
Finance & Quant · Data Science & ML
Yield-Curve PCA Quant Pipeline (Bloomberg)
By David Gadyan · Published · Updated · Client: Jonathan Cooper
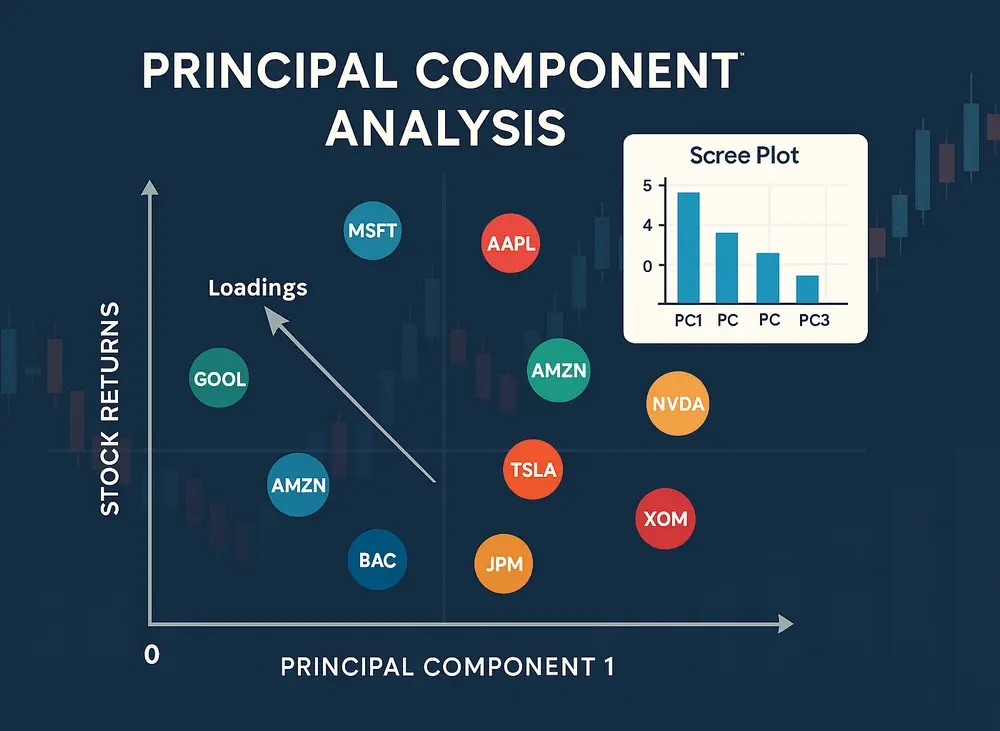
Python quant pipeline that pulls sector-by-sector yield-curve data from Bloomberg through xbbg, standardises it with pandas, numpy and StandardScaler, and applies scikit-learn PCA to extract the dominant curve movements. Reconstruction residuals flag cheap or expensive sectors automatically, optional KMeans groups similar residual patterns, and Matplotlib and Plotly charts support interactive analyst review.
The problem
A yield curve moves mostly along a few dominant factors, and a sector that drifts away from what those factors imply is cheap or expensive relative to the rest of the curve. Spotting that by eye across many sectors is slow and inconsistent. The client wanted a streamlined Python pipeline that pulls the data from Bloomberg, runs the decomposition and flags the mispriced sectors without manual work.
What I built
- Data ingestion from Bloomberg through the xbbg library, pulling sector-by-sector yield-curve series into pandas.
- Preprocessing with pandas, numpy and scikit-learn's StandardScaler so every sector sits on a comparable scale before decomposition.
- Principal Component Analysis from scikit-learn to extract the dominant curve movements across sectors.
- Reconstruction of each sector's yields from the top principal components, with the residual between actual and reconstructed yields used to flag segments as cheap or expensive automatically.
- Optional KMeans clustering to group sectors whose residual patterns look alike.
- Visual output in Matplotlib for static charts and in Plotly for interactive analysis.
Data and infrastructure
The data comes straight from Bloomberg via xbbg, so the whole workflow, from pulling the curves to flagging the mispriced sectors, runs as one Python program rather than a chain of manual exports and spreadsheets.
Outcome
PCA extracts the dominant curve movements, and the residuals from reconstructing each sector flag the mispriced segments automatically. Optional KMeans groups similar residual patterns, and the Plotly output lets the client drill into each flag interactively instead of reading tables.
Related projects

Stock Ticker Hypothesis Testing
Finance & Quant · Data Science & ML
Stock Trend & Sentiment Dashboard
Data Science & ML · Full-Stack & UI/UX · Finance & Quant

AI Trading Assistant: a Copilot That Holds You to Your Own Strategy
AI & Agents · Finance & Quant · Full-Stack & UI/UX