
Data Science & ML · Full-Stack & UI/UX · Finance & Quant
Stock Trend & Sentiment Dashboard
By David Gadyan · Published · Updated · Client: Equeum (fka Machina Software)
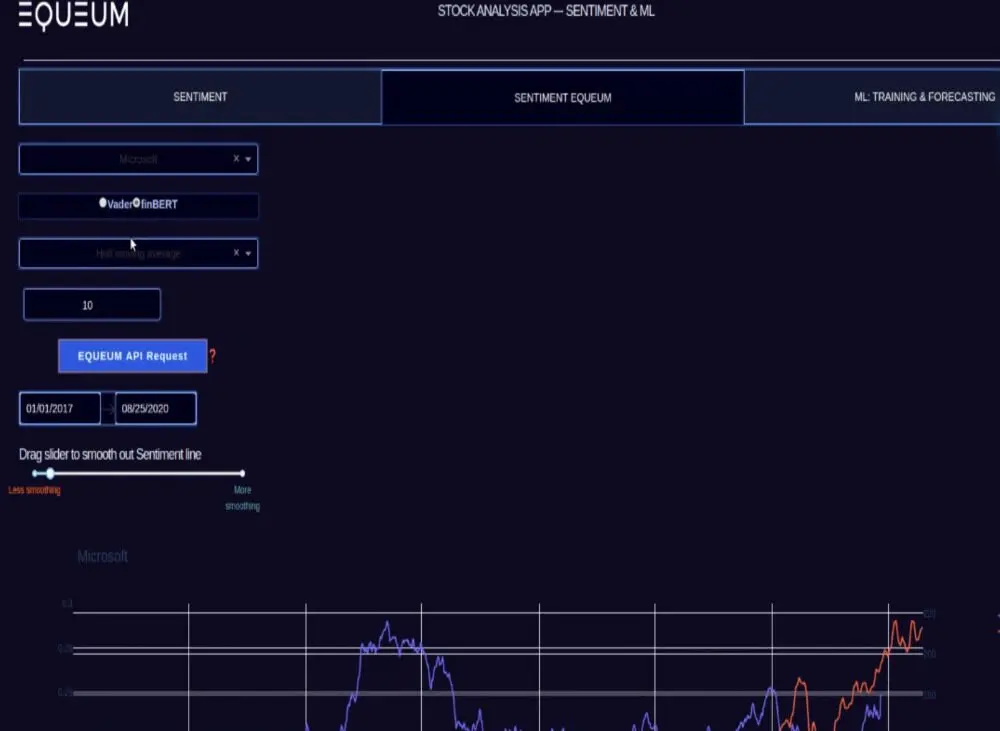
Web dashboard for Equeum (formerly Machina Software) that lets an analyst pick a stock ticker and compare its Google Trends search interest with sentiment scores from several APIs, charting correlations and patterns between the two. Built in Python as two linked apps, then extended with Reddit sentiment analysis against price changes and returns during the GameStop episode.
The problem
Equeum (formerly Machina Software) wanted a way to see whether public attention and mood around a stock moved with its price. Search interest and sentiment live in different APIs, so an analyst had to pull each one by hand before any comparison was possible. The ask was a web-based UI where someone picks a ticker and immediately sees trends, sentiment and how they relate.
What I built
- A web dashboard where the user selects a ticker from a list of supported stocks.
- Two separate apps behind it: one fetches the latest search trends for that stock from the Google Trends API, the other collects sentiment scores for it from several sentiment APIs.
- A set of charts that line the two series up and surface correlations and recurring patterns between stock sentiment and trend data.
- A Reddit analysis layer that relates price changes and returns to public sentiment for specific stocks, built around the GameStop episode.
- Python throughout, from the API clients to the correlation analysis feeding the charts.
Data and infrastructure
The value of the tool is in joining sources that were never designed to be joined: Google Trends series, scores from multiple sentiment providers, Reddit posts and price history. Each source is fetched per ticker and charted alongside the others, so the correlation views compare comparable series rather than raw, separate feeds.
Outcome
Equeum got two linked apps that turn a ticker selection into trend and sentiment series with correlation charts, plus a Reddit study showing how public sentiment tracked price moves and returns for meme stocks such as GameStop.
Related projects
AI Real Estate Lot Analysis Platform for a Residential Builder
AI & Agents · Full-Stack & UI/UX · Data Science & ML
Yield-Curve PCA Quant Pipeline (Bloomberg)
Finance & Quant · Data Science & ML

R REST API & Plotly Graphs for a Medical Testing Platform
Full-Stack & UI/UX · Data Science & ML