
Full-Stack & UI/UX · Databases & Data Engineering
Animated Data Visualisation (D3.js Race Charts)
By David Gadyan · Published · Updated · Client: Alen Kojadinovic
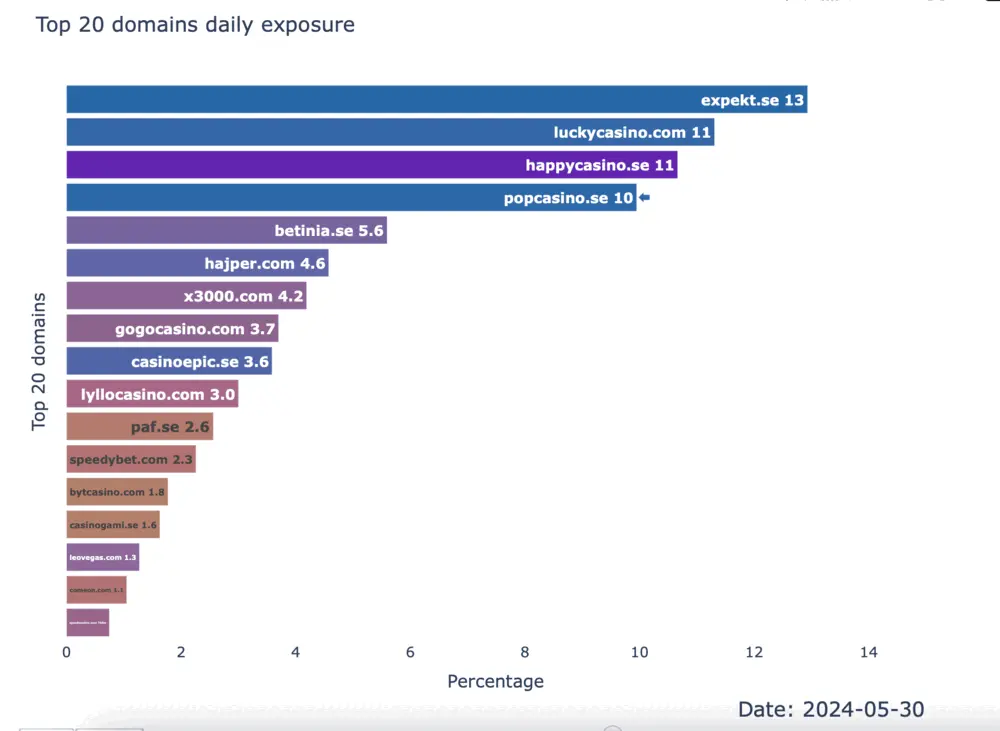
Animated bar-chart-race visualisation and reports built end to end: pandas and SQLAlchemy ETL from the client's relational databases, a Plotly Dash prototype, then a D3.js rebuild with custom JavaScript animation for frame rate and styling control, and an FFmpeg export pipeline that renders the animation as shareable video and embeddable web components.
The problem
The client needed a dynamic race-chart animation and comprehensive reports, built on data that lived in their own relational databases. The chart had to be high-fidelity: smooth motion, precise styling, and output that could be shared as video or embedded on the web. That mix of Python data work, database access and front-end animation is what the engagement was for.
What I built
- A data pipeline in Python with pandas and SQLAlchemy that extracts, transforms and loads the domain-specific datasets from the client's databases.
- A first race-chart prototype in Plotly Dash, used to benchmark performance and visual quality.
- The production race chart in D3.js with custom JavaScript animation, after the Dash prototype could not reach the required smoothness and styling control; D3 delivered better frame rates and full design fidelity.
- A video export workflow using FFmpeg and Python scripts that renders the D3 animation into shareable video formats and embeddable web components.
- Polished reports combining static graphics and animated sequences, with documentation of the toolchain and reproducible code.
Data and infrastructure
The animation sits on a real ETL layer rather than a hand-prepared file. SQLAlchemy connects to the client's relational databases, pandas handles the transformation, and the resulting datasets feed both the report graphics and the frames of the race chart.
Outcome
A race chart that runs at the smoothness and styling the client asked for, exported as video and as embeddable components, together with reports whose toolchain is documented and reproducible. The toolchain decision itself, prototyping in Dash and moving to D3.js when it fell short, was part of what was delivered.
Related projects

Marketing KPI Dashboard (Meta, Google Ads, Stripe, GA)
AI Marketing & Analytics · Full-Stack & UI/UX · Databases & Data Engineering
HubAIOps: HubSpot AI-Readiness Audit App with Claude-Written Plans
AI & Agents · AI ERP & SaaS · Full-Stack & UI/UX

Receptra: AI Voice Receptionist SaaS for Small Businesses
AI & Agents · AI ERP & SaaS · Full-Stack & UI/UX