
AI Marketing & Analytics · Full-Stack & UI/UX · Databases & Data Engineering
Marketing KPI Dashboard (Meta, Google Ads, Stripe, GA)
By David Gadyan · Published · Updated · Client: Felix Forsgren

End-to-end marketing measurement for a company that wanted to know how much its campaigns actually lift performance. I defined the KPIs, pulled the data from the Meta, Google Ads, Stripe and Google Analytics APIs in Python, computed the metrics and shipped an interactive Plotly Dash dashboard showing KPIs over time and by sector with filters.
The problem
After a few years in operation, the company wanted a straight answer to a hard question: do the marketing campaigns it runs actually boost performance, and by how much? The evidence was scattered across ad platforms, a payment provider and web analytics, none of which talked to each other, and nobody had yet defined what performance should be measured as. The details of the business stay confidential; the approach is described below.
What I built
- A KPI framework agreed with the client, so every metric answered a concrete question about campaign impact.
- A data audit: which data each KPI needed, whether the company already stored it, where, and if not which external source could supply it.
- Extraction code in Python against the Facebook/Meta API, the Google Ads API, the Stripe API and Google Analytics, after working through dozens of pages of API documentation.
- Data wrangling and KPI calculation that reconciled the sources into one consistent set of metrics.
- An interactive Plotly Dash web application showing each KPI over time and within specific sectors, driven by dropdowns and input fields.
How it was delivered
I ran the programme in stages rather than starting with the dashboard. KPI definition came first, then the data audit, then extraction, then calculation, and only then the application, so the final app answered the questions the client had actually asked rather than the ones the data happened to make easy.
Outcome
The client went from scattered platform exports to one interactive dashboard that shows how performance moves over time and by sector, filtered on demand. The KPIs are grounded in the business questions, and the data behind them is pulled directly from the Meta, Google Ads, Stripe and Google Analytics APIs.
Related projects

ImprovTalk: React Native AI Coach for Charisma and Rapport
Full-Stack & UI/UX · AI & Agents · AI Marketing & Analytics

AI Marketing: GA4, Ads, SEO & GEO/AEO
AI Marketing & Analytics · Databases & Data Engineering
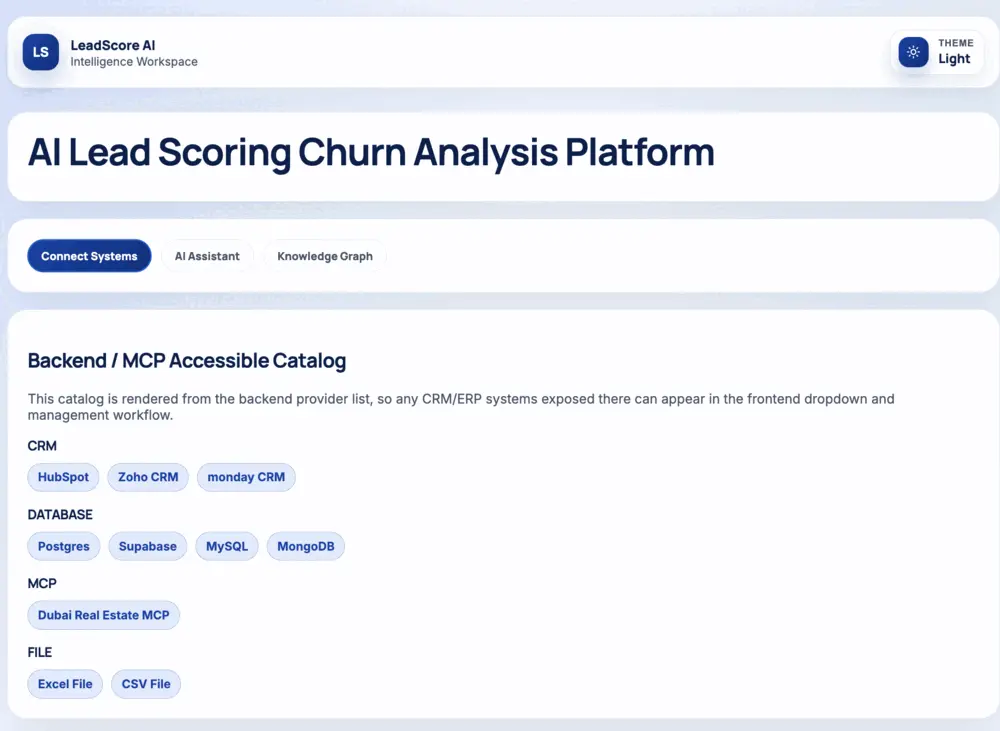
AI Lead Scoring & Churn Detection Engine (S1mple.ai)
AI ERP & SaaS · AI & Agents · AI Marketing & Analytics · Databases & Data Engineering