
Data Science & ML · Full-Stack & UI/UX · Cloud, DevOps & LLMOps
Python Cluster Analysis Web App
By David Gadyan · Published · Updated · Client: Reuben Vandeventer
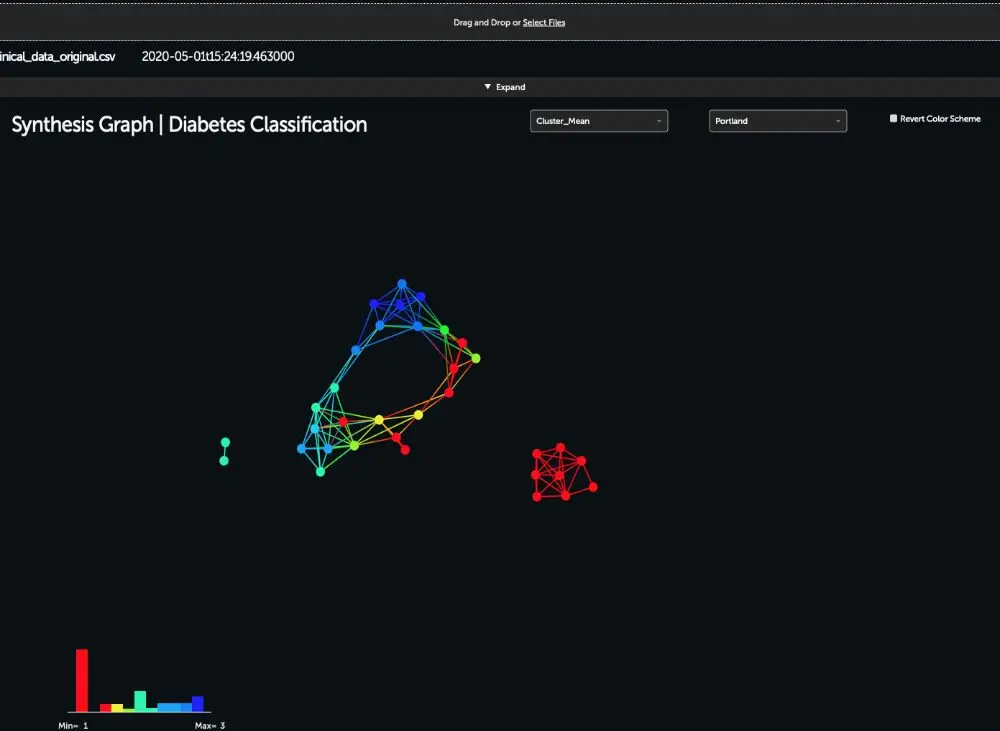
No-code clustering workbench built for Reuben Vandeventer (product owned by SecondSight): analysts upload a CSV or XLSX file, pick a record column and three dimensions, run DBSCAN, MeanShift or MST clustering from a Python web app, explore the result as an interactive D3 force-directed graph and export cluster IDs back to Excel. Deployed on Heroku.
The problem
Clustering is useful well beyond the people who can code it. The client wanted a tool that would let an analyst who understands clustering techniques, but not Python, load a dataset, try several algorithms, see the structure and take the result away in a spreadsheet, while still being flexible enough for ML engineers. The product was built for Reuben Vandeventer and is owned by SecondSight.
What I built
- A Python web application with a fixed workflow: upload a CSV or XLSX file, choose the record-name column that uniquely identifies each row, optionally normalise the data, and select X, Y and Z lenses as the three dimensions for analysis.
- Three clustering algorithms, DBSCAN, MeanShift and MST, each with its hyperparameters exposed in the UI so users can tune them without touching code.
- An interactive D3 force-directed network graph as the main output, with nodes selectable and coloured by dimension so clusters can be inspected visually.
- Export of the enriched dataset to CSV or Excel with new columns for cluster IDs and other useful information for downstream analysis.
- Deployment of the app on Heroku so the client could use it from a browser without any local setup.
How it was delivered
The whole product runs as a single web app, so the upload, normalisation, clustering and graph rendering live behind one URL. Hosting it on Heroku kept operations simple for a small team: no servers to manage, and the client could share a link rather than install anything. The original Heroku demo has since been retired.
Outcome
The application made clustering accessible to non-coders and ML engineers alike, with the full loop from raw spreadsheet to interactive graph to exported cluster IDs handled inside the browser. SecondSight holds all rights to the product.
Related projects
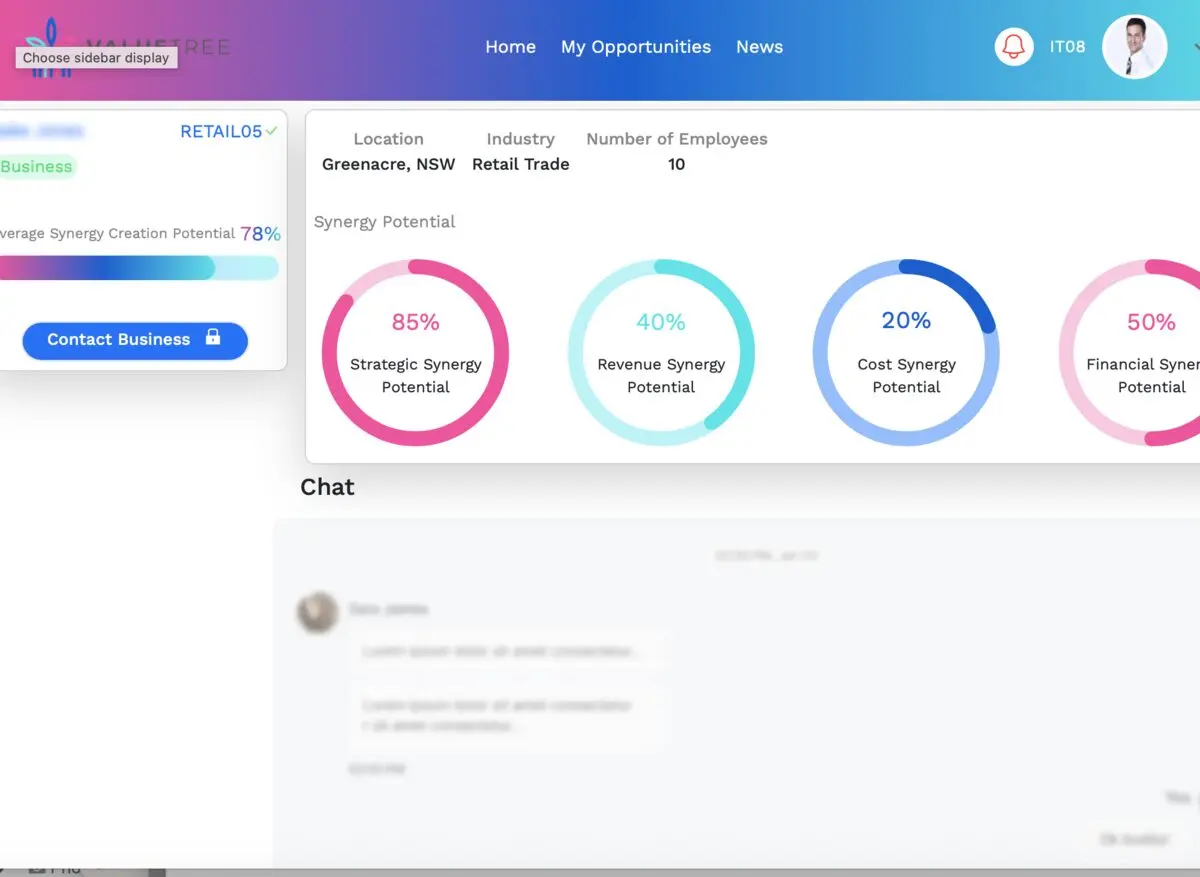
AI-Powered SME Synergy Matching Platform
Full-Stack & UI/UX · Data Science & ML · Cloud, DevOps & LLMOps
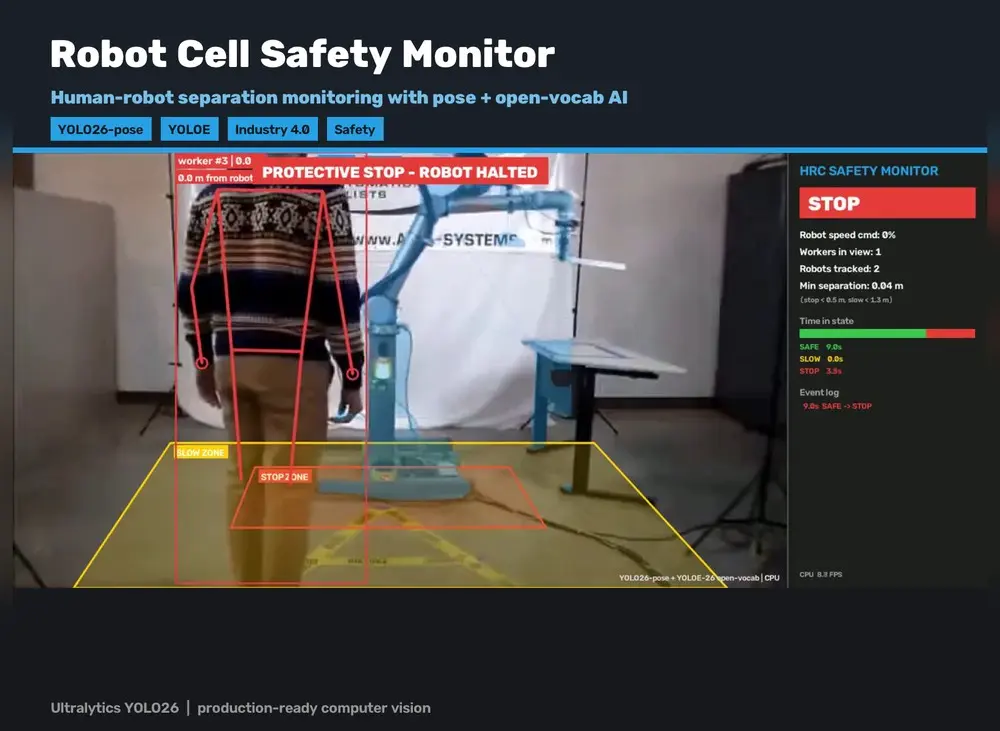
Computer Vision with YOLO26/27: Three Edge-Ready Demos
Computer Vision & Generative Media · Data Science & ML · Cloud, DevOps & LLMOps
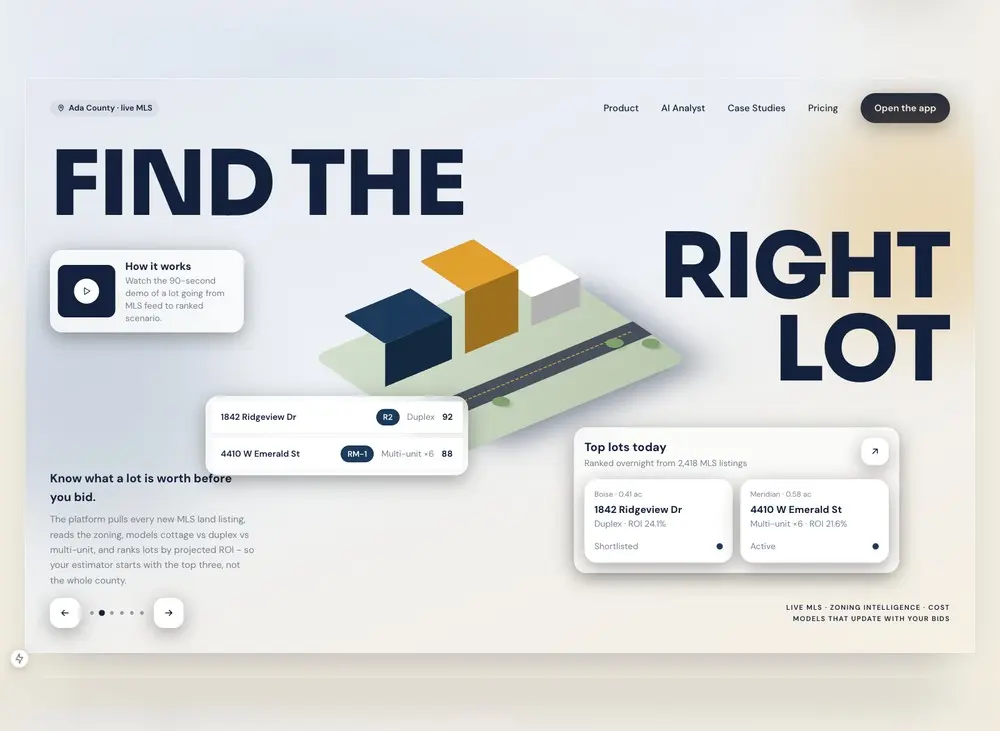
AI Real Estate Lot Analysis Platform for a Residential Builder
AI & Agents · Full-Stack & UI/UX · Data Science & ML